InSAR geodesy
InSAR geodesy
InSAR (Interferometric Synthetic Aperture Radar) has revolutionized volcanology providing dense geodetic observations (up to ~0.5 m/pixel, most likely 10-30 m/pixel), albeit with a poor temporal sampling (1-42 days depending on the SAR platform). One of the major limitations of the method is the presence of atmospheric signals produced by water vapor and pressure changes that are correlated with the topography. In the case of stratovolcanoes, these signals mimic ground deformation produced by magma reservoir pressurization, and can be very challenging to mitigate for the time scales of volcanic eruptions (0.01 - 10 days). I am develop and compare approaches that can reduce the effect of these artifacts, which are key to image volcano deformation and earthquake deformation in the Andean fold and thrust belt.

ALOS-4 stripmap interferogram wrapped (left) and unwrapped (right) of a Mw 6.4 earthquake in the active fold and thrust belt of the Colombian Andes. I developed a patch to read these data into ISCE2. The linear ramp is likely to be ionospheric.
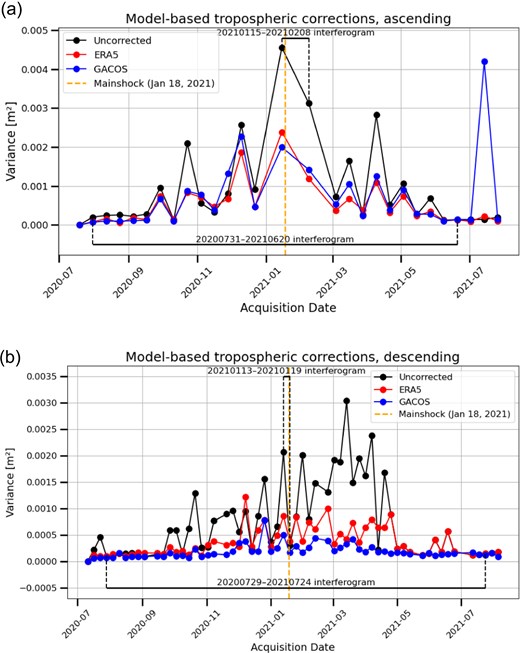
Comparison of methods to correct atmospheric phase delays in Sentinel-1 displacements reconstructed from InSAR time series in the Andean fold and thrust belt in Argentina (Leon-Ibañez and Delgado, 2025).
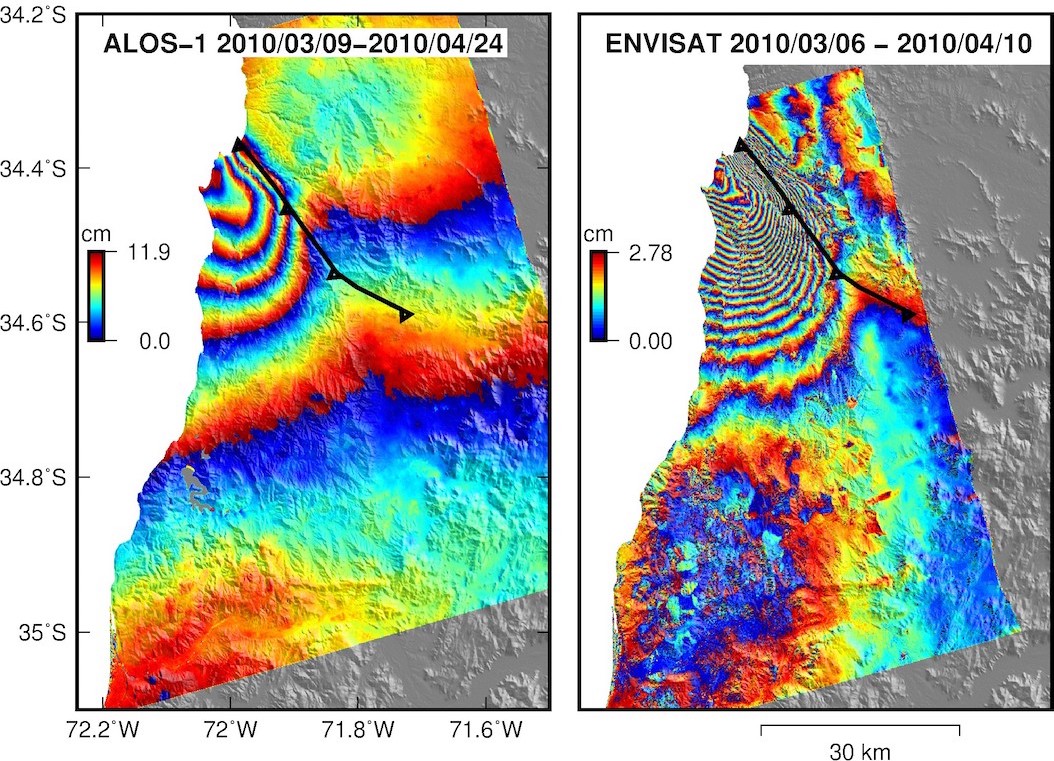
Comparison of ALOS-1 L-band and ENVISAT C-band data of the Mw 7.0 2011 Pichilemu earthquake in Central Chile. The difference in the number of fringes is given by the longer wavelength of L-band data compared with C-band data. The patchy pattern at the bottom of the ENVISAT interferogram is produced by DEM errors by forest clearcuts in this long baseline interferogram (Bp ~ 390 m). In contrast, these DEM errors are absent in the ALOS-1 interferogram which a strict small baseline pair. Also, C-band data tends to saturate near the fault trace due to high deformation gradients which are better captured by data with lower sensitivity like L-band data. C and L-band data can be considered analogous to a seismometer and a strong motion in earthquake seismology! And of course, in vegetated areas the coherence of C-band data is much lower compared to that of L-band data. But L-band data show dispersive signals like ionospheric streaks which are almost completely absent in C-band data. So each InSAR data has its unique capabilities and disadvantages and its crucial to understand them for a better use of the radar technology.
Relevant publications
Resolving ground deformation of a blind mid-crustal earthquake with InSAR amid strong phase delays: a case study of the 2021 Mw 6.4 San Juan earthquake and implications for a non-optimal fault reactivation (Andean Fold and Thrust Belt, Argentina).
León-Ibañez, P., Delgado, F., 2025. Geophysical Journal International, 243, 3, ggaf394, doi:10.1093/gji/ggaf394
A global assessment of SAOCOM-1 L-band stripmap data for InSAR characterization of volcanic, tectonic, cryospheric, and anthropogenic deformation.
Delgado, F., Shreve, T., Borgstrom, S., León-Ibañez, P., Castillo, J., Poland, M.,2024 IEEE Transactions on Geoscience and Remote Sensing, doi:10.1109/TGRS.2024.3423792.
The utility of TerraSAR-X, TanDEM-X, and PAZ for studying global volcanic activity: Successes, challenges, and future prospects.
Galetto, F., Dualeh, E., Delgado, F., Pritchard, M., Poland, M., Ebmeier, S., Shreve, T., Biggs, J., Hamling, I., Wauthier, C., Gonzalez Santana, J., Froger, J.-L., Bemelmans, M. Volcanica, 2024, 7(1), 273–301. doi: 10.30909/vol.07.01.273301.
Rhyolitic volcano dynamics in the Southern Andes: contributions from 17 years of InSAR observations at Cordon Caulle since 2003 to 2020.
Delgado, F.. Journal of South American Earth Sciences , special issue on New advances on SAR Interferometry in South America. 2020, doi:10.1016/j.jsames.2020.102841
Recent unrest (2003-2015) imaged by space geodesy at the highest risk Chilean volcanoes: Llaima, Villarrica and Calbuco (Southern Andes)
Delgado, F., Pritchard, M., Ebmeier, S., Gonzalez, P., Lara, L. Journal of Volcanology and Geothermal Research. 2017, doi:10.1016/j.jvolgeores.2017.05.020. Special issue of “Volcano Geodesy: Recent developments and future challenges”.